
Dashboard
Read operational call performance and identify where workflows need attention.
The Dashboard is the operational starting point for a workspace. It summarizes call volume, success rate, average duration, outcomes, and time-based performance so operators can understand what changed before opening an individual use case or conversation.
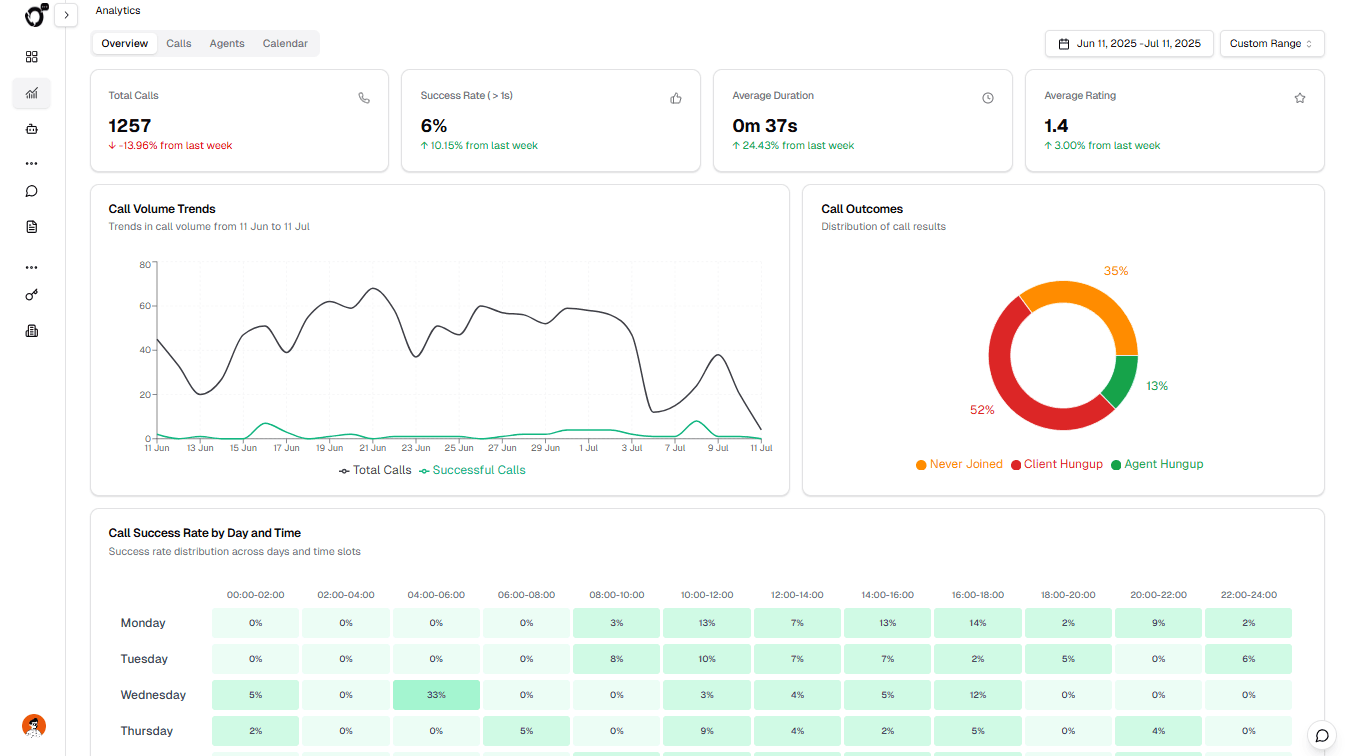
What you can monitor
- Total calls for the selected date range
- Success rate based on calls that connected for more than the configured threshold
- Average duration across completed conversations
- Call outcomes such as client hang-up, agent hang-up, or no answer
- Volume trends for spotting use case changes and delivery issues
The page also shows current plan usage and provides a direct path into a ready use case so an operator can move from monitoring to action. Analytics availability can vary by workspace plan and enabled features.
Interpret the metrics together
No single metric explains workflow quality. Read volume, connection outcomes, duration, and conversation evidence as a group:
- A volume drop with an unchanged success rate usually points to lead supply, scheduling, or a paused workflow.
- Normal volume with more unanswered calls can indicate list quality, calling-hour, or carrier issues.
- More connected calls with shorter duration can indicate an opening-message or instruction regression.
- Stable call metrics with missing CRM updates usually points to the integration rather than the agent.
Dashboard analytics are directional operational signals. Use the underlying conversation when investigating a customer-specific result.
Recommended workflow
- Select the date range that matches the use case or release you are reviewing.
- Compare call volume and success rate with the previous period.
- Inspect outcome distribution for sudden increases in unanswered or short calls.
- Open Conversations to review transcripts and recordings behind the trend.
- Adjust the use case, agent instructions, or lead schedule and monitor the next run.
After changing a workflow
Record when the change was released, narrow the date range to the new traffic, and compare like-for-like use cases. Avoid combining unrelated use cases or different customer segments in the same diagnosis.
Tip: Use a narrow date range after changing an agent or use case. It makes regressions easier to isolate from older traffic.
Open the Dashboard to review your workspace.
How is this guide?